CloudWatch
·
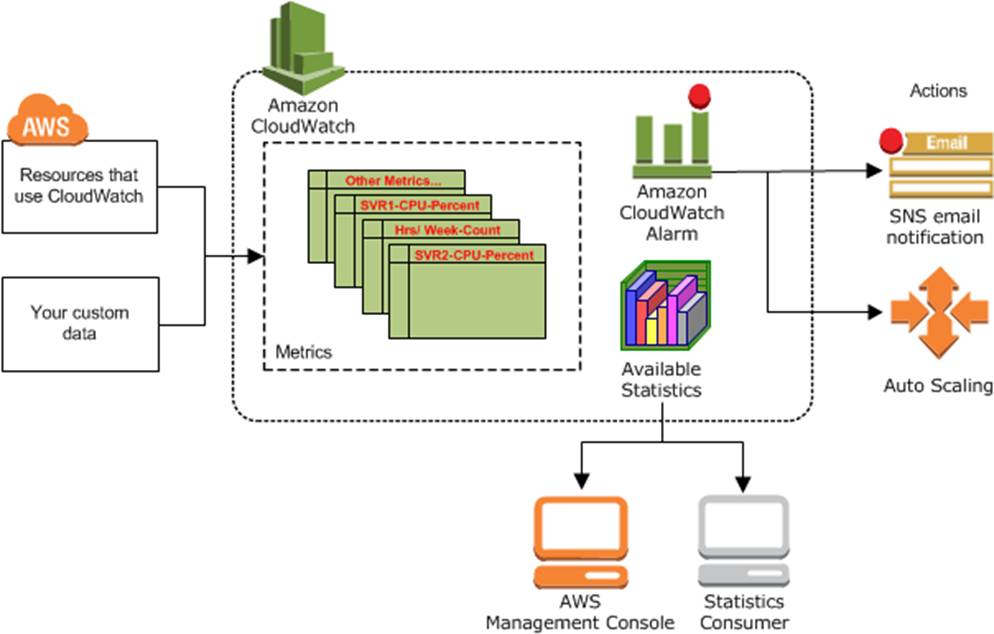
Monitoring tool for AWS resources and
applications
·
Display metrics and create alarms
that watch the metrics and send notifications and send notifications or
automatically make changes to the resources you are monitoring when a threshold
is breached.

·
Cloudwatch does not aggregate data
across regions. Therefore, metrics are completely separate between regions.
·
CloudWatch
Concepts
o Namespaces - a
container for CloudWatch metrics.
§
There is no default namespace
§
The AWS namespace uses the following
convention AWS\Service
o Metrics - represents
a time-ordered set of data points that are published to CloudWatch
§
Provisioned metrics
v
Basic - 5 minutes (default )
v
Detailed - 1 minute (paid )
v
CPU (if T2/3 can get credit usage for
the Burst), Network IO , Disk Read/Write/Ops (instance store backed) and status
checks (EC2 VM or System)
§
Custom Metrics (yours to push)
v
Basic resolution - 1 minute
v
High resolution - all the way to one
second
v
includes RAM, Swap, Application level
metrics
v
make sure the permissions on the EC2
role are correct (CloudWatchFullAccess)
o Dimensions - a
name/value pair that uniquely identifies a metric.
o Statistics - metric
data aggregations over specified periods of time
§
·
Percentiles
·
Alarms
o Alarms
are used to Trigger notifications for any metric
o Alarms
can go to Auto Scaling, EC2
instances, sns notifications
o Various
Options (sampling, %, max, min etc ...)
o Alarm
States
§
OK
§
Insufficient Data
§
ALARM
o Period
§
Length of time to evaluate the metric
§
High resolution metrics can be 10, 30
seconds
§
High resolution custom metrics can be
1+ second
·
CloudWatch
Dashboard
o multi
region and can display any widget to any region, to do so just change to the
region of the widget and add to the dashboard (then save)
·
CloudWatch
Events
o Source
+ Rule => Target
o Schedule:
Cron jobs
o Event
Pattern: Event rules to detect a service doing something,
o Triggers
to lambda functions, SQS, SNS, Kinesis Messages
o CloudWatch
event create a small JSON document to give information about the change
·
CloudWatch
Log
o Features
§
Monitor logs from EC2 instances in
real time (install the CloudWatch agent in the EC2, can also install the agent
on premise)
§
Monitor CloudTrail logged events
§
By default, logs are kept
indefinitely and never expire
§
Archive log data
§
Log route53 DNS queries
o CloudWatch Logs insights -
allows you to interactively search and analyse your log data in CloudWatch Logs
using queries
o CloudWatch Vended Logs - are logs that are natively
published on by AWS services on
behalf of the customer. VPC Flow Flogs is
the first Vended log type that will benifit from this
tiered model.
·
CloudWatch
Agent
o Collects
more logs and system level metrics from EC2 instances and your
on premise servers
o Needs
to be installed
·
Authentication
and Access Control
o Use
IAM users or roles for authenticating who can access
o Use
Dashboard Permissions, IAM identity-based policies, and service-linked roles
for managing access control
o A permissions policy describes who has access
to what
§
Identity-Based Policies
§
Resource-Based Policies
o There
are no CloudWatch ARNS for you to use in an IAM policy. Use an *(asterisk)
instead of the resource when writing a policy to control access to CloudWatch
actions
·
Pricing
·
Limits